
As President Donald Trump enacts stricter immigration policies, a group of business and political leaders are highlighting how immigrants fit into the U.S. economy.
New American Economy, a coalition of companies and elected officials, mapped out the numbers, showing how many immigrants live in each state, how much they pay in taxes, and how much spending power they have.
“It's not only a human rights issue, but it is an economic issue that we stand to lose, and particularly Washington state stands to lose, if we don't truly figure out how to keep immigrants successfully integrated in our state,” said Roxana Norouzi, director of education and integration policy for OneAmerica, a non-profit that works with immigrants in Washington.
Here are the stats for Washington:
- Immigrant Residents: 929,505
- Immigrant Share of Population: 13.2 percent
- Immigrant Taxes Paid (2014): $8.1 billion
- Immigrant Spending Power (2014): $22.8 billion
- Immigrant Entrepreneurs: 57,780
- Employees at Immigrant-Owned Firms: 141,483
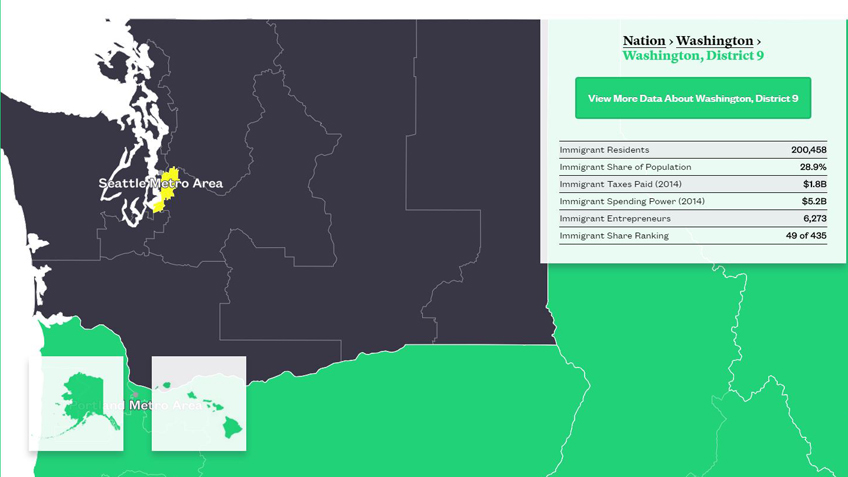
Browse the breakdown in Washington state by city and county, as well as data from other states here.